First Fiscal Quarter With Revenue in Excess of $2 Million
LANGHORNE, Pa., May 14, 2015 (GLOBE NEWSWIRE) -- Alliqua BioMedical, Inc. (Nasdaq:ALQA) ("Alliqua" or "the Company"), a provider of advanced wound care products, today announced financial results for the first quarter ended March 31, 2015.
Q1 Highlights:
- Total revenue increased 258% year-over-year to $2.1 million. Organic revenue growth was 169% year-over-year.
- Proprietary products revenue increased 1,215% year-over-year to $1.4 million. Organic proprietary product revenue growth was 748% year-over-year.
- On January 5th, the Company announced a Group Purchasing Agreement with Premier, Inc.
- On February 2nd, the Company announced a definitive agreement to acquire Celleration, Inc. for an initial purchase price of approximately $30.4 million, which is comprised of both cash and stock.
Highlights Subsequent to Quarter-End:
- On April 16th, Alliqua announced that the Company's Biovance® Human Amniotic Membrane Allograft received coverage from Novitas Solutions, Inc. ("Novitas"), a Medicare Administrative Contractor, or "MAC".
- On May 4th, the Company raised gross proceeds of $34.5 million through a follow-on offering of 7,582,418 shares of its common stock at a price to the public of $4.55 per share.
"We are pleased with our first quarter revenue performance and feel that we are off to a great start to fiscal year 2015," said David Johnson, Chief Executive Officer of Alliqua. "This was the Company's first fiscal quarter with revenue in excess of $2 million - a milestone for the Company - driven by solid contributions from our proprietary products segment, particularly our sorbion franchise, and a strong quarter for our contract manufacturing business."
"Our recently announced agreement to acquire Celleration is proceeding ahead of plan, and we now expect to close on May 29th. We continue to remain focused on obtaining Medicare Administrative Contractor (MAC) coverage for our Biovance Human Amniotic Membrane Allograft, and we were pleased to announce that we added our first MAC, Novitas, on April 10th. In light of our accomplishments so far this year, I am proud of our significant progress, and look forward to the future for Alliqua, as we continue to execute on our strategic growth plan, expand our addressable market and drive adoption of our innovative technologies in the advanced wound care market."
| Alliqua BioMedical, Inc. and Subsidiaries | ||||
| Revenue Summary | ||||
| ($, Thousands) | Three Months Ended March 31, | Increase / Decrease | ||
| 2015 | 2014 | $ Change | % Change | |
| Proprietary Products | $1,477.4 | $112.3 | $1,365.1 | 1215.6% |
| Contract Manufacturing | 636.1 | 478.3 | 157.8 | 33.0% |
| Revenue, net | $2,113.5 | $590.6 | $1,522.9 | 257.9% |
First Quarter 2015 Results:
Total revenue for the first quarter of 2015 increased $1.5 million, or 258% year-over-year, to $2.1 million. Sales of the Company's proprietary products - including hydrogels, sorbion, Biovance and TheraBond - increased $1.4 million, or 1,215%, year-over-year. First quarter 2015 revenue includes contributions from Choice Therapeutics, which we acquired in May 2014, of approximately $526 thousand. Excluding the contributions from the acquisition of Choice Therapeutics, the Company's proprietary products' revenue increased in the first quarter 748%, year-over-year.
Gross profit for the first quarter of 2015 was $0.9 million, or 42.9% of sales, compared to a gross loss of $41 thousand during the same period last year. The increase in gross margin was driven by the change in product mix due to increased sales of proprietary products, which represented 70% of sales in the first quarter of fiscal year 2015, compared to 19% of sales during the same period last year. Gross margin on our proprietary product sales was approximately 73% in the first quarter of fiscal year 2015.
Total operating expenses for the first quarter of 2015 decreased $129 thousand, or 1% year-over-year, to $8.6 million. First quarter of 2015 total operating expenses included a charge of $1.9 million related to costs associated with the Company's acquisition of Celleration. Excluding the acquisition-related expenses, adjusted operating expenses decreased $2.1 million, or 24%, year-over-year. The decrease in adjusted operating expenses in the first quarter of 2015 was driven primarily by lower stock-based compensation expense, due to a decrease in equity awards granted to consultants. Stock-based compensation was $1.9 million and $5.1 million for the three months ended March 31, 2015 and 2014, respectively.
Loss from operations for the first quarter of 2015 was $7.7 million, compared to a loss of $8.8 million for the same period last year. Net loss for the first quarter of 2015 was $7.7 million, or ($0.48) per diluted share, compared to a net loss of $9.0 million, or ($0.73) per diluted share, last year. Non-GAAP net loss for the first quarter of 2015 was $3.4 million, or ($0.21) per diluted share, compared to a non-GAAP net loss of $3.4 million, or ($0.28) per diluted share, last year. The Company defines non-GAAP net income as its reported net income (GAAP) excluding stock-compensation expense, one-time charges and other non-recurring operating costs and expenses, change in fair value of contingent consideration and change in value of warrant liability.
As of March 31, 2015, the Company had $10.9 million in cash and cash equivalents, compared to $16.8 million at December 31, 2014. The decrease was attributable to cash used in operating activities of $5.9 million during the three months ended March 31, 2015. Net cash flow used in operating activities included approximately $1.2 million of transaction costs related to our acquisition of Celleration during the three months ended March 31, 2015. Changes in working capital increased cash flows used in operating activities approximately $1.4 million in the three months ended March 31, 2015 compared to the three months ended March 31, 2014.
Subsequent to March 31, 2015, the Company received net proceeds, after taking into account underwriting discounts, of $32,430,000 from the follow-on offering of its common stock.
On February 2, 2015, the Company entered in a merger agreement to acquire Celleration (the "Merger Agreement"). The Merger Agreement provides for an initial aggregate purchase price of $30,415,000, payable in equal amounts of cash and our common stock. In connection with the Merger Agreement, the Company also received a commitment letter from a lender in which the lender has committed to provide the Company with a senior, secured term loan facility in the amount of $15,500,000. The Company expects to use the proceeds from this loan facility to finance the upfront cash portion of the purchase price under the Merger Agreement.
Fiscal Year 2015 Revenue Outlook:
The Company is maintaining its revenue guidance for the fiscal year 2015 period, which was last updated on April 23rd, 2015. The Company's revenue guidance reflects the expected incremental contributions from the acquisition of Celleration, based on a closing date of May 29th.
- For the fiscal year ending December 31, 2015, the Company expects total revenue of $16.3 million to $18.8 million, representing growth at the mid-point of the range of approximately 267% year-over-year. Celleration revenue for the second-half of fiscal year 2015 is expected in the range of approximately $5.3 million to $5.8 million.
Conference Call
The Company will host a teleconference at 5:00 p.m. Eastern Time on May 14th to discuss the results of the quarter, and to host a question and answer session. Those interested in participating on the call may dial 888-539-3612 (719-325-2420 for international callers) and provide access code 5601001 approximately 10 minutes prior to the start time. A live webcast of the call will be made available on the investor relations section of the Company's website at http://ir.alliqua.com.
For those unable to participate, a replay of the call will be available for two weeks at 888-203-1112 (719-457-0820 for international callers); access code 5601001. The webcast will be archived on the investor relations section of Alliqua's website.
About Alliqua BioMedical, Inc.
Alliqua is a provider of advanced wound care solutions. Through its sales and distribution network, together with its proprietary products, Alliqua provides a suite of technological solutions to enhance the wound care practitioner's ability to deal with the challenges of healing both chronic and acute wounds.
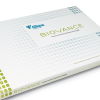
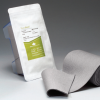
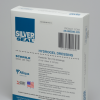
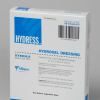
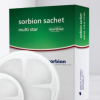
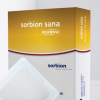
Alliqua currently markets its line of hydrogel products for wound care under the SilverSeal® and Hydress® brands, as well as the sorbion sachet S® and sorbion sana® wound care products, and its TheraBond 3D® advanced dressing which incorporates the TheraBond 3D® Antimicrobial Barrier Systems technology. It also markets the advanced wound care product Biovance®, as part of its licensing agreement with Celgene Cellular Therapeutics.
In addition, Alliqua can provide a custom manufacturing solution to partners in the medical device and cosmetics industry, utilizing its proprietary hydrogel technology. Alliqua's electron beam production process, located at its 16,500 square foot Good Manufacturing Practice (GMP) manufacturing facility in Langhorne, PA, allows Alliqua to develop and custom manufacture a wide variety of hydrogels. Alliqua's hydrogels can be customized for various transdermal applications to address market opportunities in the treatment of wounds as well as the delivery of numerous drugs or other agents for pharmaceutical and cosmetic industries.
Legal Notice Regarding Forward-Looking Statements:
This release contains forward-looking statements. Forward-looking statements are generally identifiable by the use of words like "may," "will," "should," "could," "expect," "anticipate," "estimate," "believe," "intend," or "project" or the negative of these words or other variations on these words or comparable terminology. The reader is cautioned not to put undue reliance on these forward-looking statements, as these statements are subject to numerous factors and uncertainties outside of our control that can make such statements untrue, including, but not limited to, the adequacy of the Company's liquidity to pursue its complete business objectives; inadequate capital; the Company's ability to obtain reimbursement from fourth party payers for its products; loss or retirement of key executives; adverse economic conditions or intense competition; loss of a key customer or supplier; entry of new competitors and products; adverse federal, state and local government regulation; technological obsolescence of the Company's products; technical problems with the Company's research and products; the Company's ability to expand its business through strategic acquisitions; the Company's ability to integrate acquisitions and related businesses; price increases for supplies and components; and the inability to carry out research, development and commercialization plans. In addition, other factors that could cause actual results to differ materially are discussed in our filings with the SEC, including our most recent Annual Report on Form 10-K filed with the SEC, and our most recent Form 10-Q filings with the SEC. Investors and security holders are urged to read these documents free of charge on the SEC's web site at http://www.sec.gov. We undertake no obligation to publicly update or revise our forward-looking statements as a result of new information, future events or otherwise.
Use of Non-GAAP Financial Measures
We present these non-GAAP measures because we believe these measures are useful indicators of our operating performance. Our management uses these non-GAAP measures principally as a measure of our operating performance and believes that these measures are useful to investors because they are frequently used by analysts, investors and other interested parties to evaluate companies in our industry. We also believe that these measures are useful to our management and investors as a measure of comparative operating performance from period to period.
The Company has presented the following non-GAAP financial measures in this press release: non-GAAP net income, and non-GAAP net income per share. The Company defines non-GAAP net income as its reported net income (GAAP) excluding stock-compensation expense, one-time charges and other non-recurring operating costs and expenses, intangible asset amortization, change in fair value of contingent consideration and change in value of warrant liability.
| ALLIQUA BIOMEDICAL, INC. AND SUBSIDIARIES | ||
| CONDENSED CONSOLIDATED BALANCE SHEETS | ||
| March 31, | December 31, | |
| 2015 | 2014 | |
| (Unaudited) | ||
| ASSETS: | ||
| Current Assets: | ||
| Cash and cash equivalents | $ 10,939,194 | $ 16,770,879 |
| Accounts receivable | 1,403,595 | 968,616 |
| Inventory, net | 1,601,727 | 1,411,748 |
| Prepaid expenses and other current assets | 814,278 | 477,824 |
| Total current assets | 14,758,794 | 19,629,067 |
| Improvements and equipment, net | 1,360,534 | 1,434,027 |
| Intangible assets, net | 4,154,624 | 4,387,293 |
| Goodwill | 4,100,295 | 4,100,295 |
| Other assets | 173,042 | 173,042 |
| Total assets | $ 24,547,289 | $ 29,723,724 |
| LIABILITIES AND STOCKHOLDERS' EQUITY | ||
| Current Liabilities: | ||
| Accounts payable | $ 1,802,498 | $ 1,757,742 |
| Accrued expenses and other current liabilities | 2,330,876 | 2,067,859 |
| Warrant liability | 292,181 | 304,223 |
| Total current liabilities | 4,425,555 | 4,129,824 |
| Contingent consideration | 3,039,134 | 2,931,598 |
| Deferred tax obligation | 69,835 | 67,000 |
| Other long-term liabilities | 81,986 | 84,071 |
| Total liabilities | 7,616,510 | 7,212,493 |
| Commitments and Contingencies | ||
| Stockholders' Equity | ||
| Preferred Stock, par value $0.001 per share, 1,000,000 shares authorized, no shares issued and outstanding | -- | -- |
| Common Stock, par value $0.001 per share, 45,714,286 shares authorized; 16,821,243 and 16,202,689 shares issued and outstanding as of March 31, 2015 and December 31, 2014, respectively | 16,822 | 16,203 |
| Additional paid-in capital | 94,618,263 | 92,537,742 |
| Accumulated deficit | (77,704,306) | (70,042,714) |
| Total stockholders' equity | 16,930,779 | 22,511,231 |
| Total liabilities and stockholders' equity | $ 24,547,289 | $ 29,723,724 |
| ALLIQUA BIOMEDICAL, INC. AND SUBSIDIARIES | ||
| CONDENSED CONSOLIDATED STATEMENTS OF OPERATIONS | ||
| (UNAUDITED) | ||
| Three Months Ended March 31, | ||
| 2015 | 2014 | |
| Revenue, net of returns, allowances and discounts | $ 2,113,564 | $ 590,575 |
| Cost of revenues | 1,207,064 | 631,699 |
| Gross profit (loss) | 906,500 | (41,124) |
| Operating expenses | ||
| Selling, general and administrative (1) | 6,529,941 | 8,646,544 |
| Acquisition-related expenses | 1,945,789 | 65,982 |
| Change in fair value of contingent consideration liability | 107,536 | -- |
| Total operating expenses | 8,583,266 | 8,712,526 |
| Loss from operations | (7,676,766) | (8,753,650) |
| Other income (expense) | ||
| Interest expense | -- | (292) |
| Interest income | 5,967 | 4,547 |
| Change in value of warrant liability | 12,042 | (283,267) |
| Total other income (expense) | 18,009 | (279,012) |
| Loss before income tax provision | (7,658,757) | (9,032,662) |
| Income tax provision | 2,835 | 3,500 |
| Net loss | (7,661,592) | (9,036,162) |
| Basic and diluted net loss per common share | $ (0.48) | $ (0.73) |
| Weighted average shares used in computing basic and diluted net loss per common share | 16,068,562 | 12,356,096 |
| (1) Inclusive of stock-based compensation of $1,940,912 and $5,144,315 for the three months ended March 31, 2015 and 2014, respectively. | ||
| ALLIQUA BIOMEDICAL, INC. AND SUBSIDIARIES | ||
| Reconciliation of GAAP to Non-GAAP results | ||
| (Unaudited) | ||
| Three Months Ended March 31, | ||
| (U.S. dollars in thousands) | 2015 | 2014 |
| Table of Reconciliation from GAAP Net Loss to Non-GAAP Net Loss | ||
| GAAP Net Loss | $ (7,662) | $ (9,036) |
| Stock-based compensation | 2,033 | 5,162 |
| Acquisition-related expenses | 1,946 | 66 |
| Intangible asset amortization | 233 | 107 |
| Change in fair value of contingent consideration liability | 108 | -- |
| Change in value of warrant liability | (12) | 283 |
| Non-GAAP Net Loss | $ (3,354) | $ (3,418) |
| Table Comparing GAAP Diluted Net Loss Per Common Share to Non-GAAP Diluted Net Loss Per Common Share | ||
| GAAP diluted net loss per common share | $ (0.48) | $ (0.73) |
| Non-GAAP diluted net loss per common share | $ (0.21) | $ (0.28) |
| Shares used in computing GAAP diluted net loss per common share | 16,068,562 | 12,356,096 |
| Shares used in computing Non-GAAP diluted net loss per common share | 16,068,562 | 12,356,096 |
CONTACT: Investor Relations:
         Westwicke Partners on behalf of Alliqua BioMedical, Inc.
         Mike Piccinino, CFA +1-443-213-0500
         [email protected]
Source: Alliqua BioMedical, Inc.


