Third Quarter Product Revenue Growth of 18% year-over-year
YARDLEY, Pa., Nov. 04, 2016 (GLOBE NEWSWIRE) -- Alliqua BioMedical, Inc. (Nasdaq:ALQA) ("Alliqua" or "the Company"), a regenerative technologies company committed to restoring tissue and rebuilding lives, today announced financial results for the third quarter ended September 30, 2016.
Third Quarter 2016 Financial Summary:
- Total revenue of $4.9 million, up 16% year-over-year, compared to total revenue of $4.2 million in the third quarter of 2015. Total revenue in the third quarter of 2015 excludes approximately $828 thousand of sales that are now included in discontinued operations following the sale of the Company’s sorbion product franchise announced on July 7, 2016.
- Product revenue of $4.4 million from continuing operations is up 18% year-over-year, compared to product revenue of $3.7 million.
- Gross margin was 64%, compared to 66% in the same period last year and 64% in the second quarter of fiscal year 2016.
Third Quarter 2016 Operating Highlights:
- In July, the Company announced that it had entered into a definitive agreement with BSN medical, Inc. (“BSN”) for the sale of Alliqua’s exclusive distribution rights for sorbion® sachet® and sorbion® sana primary dressings in the United States, Canada and Latin America. Under the terms and conditions of the agreement, Alliqua received total consideration of $4.1 million from BSN for the exclusive distribution rights and unsold inventory.
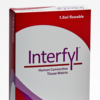
- In September, the Company announced the commercial introduction of its latest regenerative technology, Interfyl™ Human Connective Tissue Matrix.
Highlights Subsequent to Quarter-End:
- In October, the Company signed a definitive agreement to acquire the business of Soluble Systems, LLC (“Soluble”). The transactions are expected to close in the first quarter of 2017 and are contingent upon the Company securing debt or equity financing, or combination, thereof, that results in gross proceeds of at least $45 million, inclusive of any current indebtedness of Soluble or the Company that is assumed, restructured or refinanced by the combined company. The transactions are also subject to various customary closing conditions, including the filing of a registration statement with the Securities and Exchange Commission (the “SEC”), the approval of Alliqua's stockholders and the receipt of certain third party consents, including the senior lenders of both Alliqua and Soluble.
- In October, the Company announced that its MIST Therapy System® is eligible for Medicare reimbursement coverage in the geographic regions covered by First Coast Service Options Inc. (“First Coast”), a Medicare Administrative Contractor, or “MAC.” With the addition of coverage from First Coast, Medicare coverage for MIST Therapy now includes all Medicare Administrative Contractors in the United States.
- In October, the Company hosted two symposia at the Fall 2016 Symposium on Advanced Wound Care (“SAWC”) in Las Vegas, Nevada.
"We were excited by the strong revenue growth that we saw in the third quarter, which was fueled by continued commercial strength in sales of our biologic product, Biovance, combined with record sales of our MIST Therapy platform,” said David Johnson, Chief Executive Officer of Alliqua. “In addition to our financial performance, we were also pleased to announce the enhancement of our biologics portfolio with commercial introduction of our Interfyl Human Connective Tissue Matrix during the third quarter, as we continue to focus on building out our capabilities as a provider of regenerative solutions. As the year draws to a close, we remain focused on continuing the pace of commercial progress that we have achieved in the third quarter, while working to further enhance our competitive position in the marketplace by combining our business with Soluble Systems.”
Third Quarter 2016 Results:
| Alliqua BioMedical, Inc. and Subsidiaries | |||||||||||||||||||||||||
| Revenue Summary* | |||||||||||||||||||||||||
| Three Months Ended | Nine Months Ended | ||||||||||||||||||||||||
| ($, Thousands) | September 30, | Increase / Decrease | September 30, | Increase / Decrease | |||||||||||||||||||||
| 2016 | 2015 | $ Change | % Change | 2016 | 2015 | $ Change | % Change | ||||||||||||||||||
| Products | $ | 4,355 | $ | 3,678 | $ | 677 | 18 | % | $ | 11,417 | $ | 6,608 | $ | 4,809 | 73 | % | |||||||||
| Contract Manufacturing | $ | 519 | $ | 507 | $ | 12 | 2 | % | $ | 1,881 | $ | 1,626 | $ | 255 | 16 | % | |||||||||
| Revenue, net | $ | 4,874 | $ | 4,185 | $ | 689 | 16 | % | $ | 13,298 | $ | 8,234 | $ | 5,064 | 61 | % | |||||||||
| *Revenue summary reflects the Company's continued operations, and, therefore, excludes approximately $0 and $1.7 million of sorbion revenue recognized during the three and nine months ended September 30, 2016, and $828 thousand and $2.0 million of sorbion revenue recognized during the three and nine months ended September 30, 2015, respectively, that is included in discontinued operations. | |||||||||||||||||||||||||
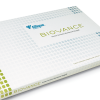
Total revenue for the third quarter of 2016 increased by $689 thousand, or 16% year-over-year, to $4.9 million, compared to $4.2 million last year. Total revenue for the third quarter of 2015 excluded revenue from sales of sorbion products of approximately $828 thousand that is included in discontinued operations following the Company’s sale of the sorbion product franchise. Sales of the Company’s products – including hydrogels, Biovance, TheraBond and MIST Therapy – increased by $677 thousand, or 18%, year-over-year, from $3.7 million to $4.4 million. Sales of Biovance and MIST Therapy systems were the biggest contributors to this growth.
Gross profit for the third quarter of 2016 was $3.1 million, or 64% of sales, compared to a gross profit of $2.7 million, or 66% of sales, last year. Gross margin on product sales was approximately 75% in the third quarter of 2016, compared to 82% of sales last year. The year-over-year decline in product gross margin was due primarily to lower margins on MIST Therapy systems in the third quarter 2016 compared to third quarter 2015. The product gross margin in the third quarter of 2016 is consistent with product gross margins reported in previous quarters of 2016.
Total operating expenses for the third quarter of 2016 decreased by $65 thousand, or 1% year-over-year, to $10.9 million. The decrease in total operating expenses in the period was largely due to a decrease in selling, general and administrative expenses of $1.2 million and a decrease in the fair value of the Company’s contingent consideration liability of $488 thousand. The year-over-year decrease in total operating expenses driven by these items was nearly offset, by incremental expenses totaling $1.7 million driven by a milestone expense related to the launch of Interfyl and acquisition expenses related to the transaction with Soluble.
GAAP loss from operations for the third quarter of 2016 was $7.8 million, compared to a loss of $8.2 million for the same period last year.
GAAP net loss for the third quarter of 2016 was $8.6 million, or ($0.30) per diluted share, compared to a GAAP net loss of $7.1 million, or ($0.26) per diluted share, for the same period last year. The change in GAAP net loss over the prior year period was driven by changes in fair value of the Company’s warrant liability, which resulted in a gain of $135 thousand in the third quarter of 2016, compared to a gain of $1.5 million last year. GAAP net loss in the third quarter of 2015 also included $379 thousand of income from discontinued operations related to the Company’s sale of its sorbion product franchise.
Non-GAAP net loss from continuing operations for the third quarter of 2016 was $4.6 million, or ($0.16) per diluted share, compared to a non-GAAP net loss from continuing operations of $5.1 million, or ($0.19) per diluted share, for the same period last year. The Company defines non-GAAP net loss from continuing operations as its reported net loss (GAAP), excluding income tax expense (benefit), stock-compensation expense, one-time charges and other non-recurring operating costs and expenses, intangible asset amortization, change in fair value of contingent consideration, change in value of warrant liability and income from discontinued operations.
Nine Months 2016 Results:
Total revenue for the nine months ended September 30, 2016, increased by $5.1 million, or 61% year-over-year, to $13.3 million, compared to $8.2 million last year. Total revenue for the nine months ended September 30, 2016 and September 30, 2015 exclude $1.7 million and $2.0 million, respectively, of revenue from sales of sorbion products, recorded as discontinued operations following the Company’s sale of the sorbion product franchise.
GAAP net loss for the nine months ended September 30, 2016 and 2015, was $11.1 million, or $(0.40) per diluted share, and $21.8 million, or $(1.00) per diluted share, respectively. GAAP net loss for the nine months ended September 30, 2016 and 2015 included $4.2 million and $799 thousand, respectively, of income from discontinued operations.
Non-GAAP net loss from continuing operations for the nine months ended September 30, 2016 was $15.7 million, or $(0.56) per diluted share, compared to a non-GAAP net loss from continuing operations of $13.4 million, or $(0.61) per diluted share in the prior year period. The Company defines non-GAAP net loss from continuing operations as its reported net loss (GAAP) excluding income tax expense (benefit), stock-compensation expense, one-time charges and other non-recurring operating costs and expenses, intangible asset amortization, change in fair value of contingent consideration, change in value of warrant liability and income from discontinued operations.
Cash and Cash Equivalents:
As of September 30, 2016, the Company had cash and cash equivalents of approximately $10.7 million, compared to $26.1 million at December 31, 2015. The decrease in cash was driven by $14.0 million of cash used in operating activities, $2.6 million of cash used to pay a portion of the contingent consideration related to the Celleration acquisition, $1.8 million of cash used to repay a portion of the Company’s long-term debt, purchases of improvements and equipment of $0.6 million and $0.5 million provided to Soluble as a bridge loan. The decrease in cash during the first nine months of 2016, was partially offset by $4.1 million of cash received in connection with the sale of the rights to the sorbion product from BSN.
Updated Fiscal Year 2016 Revenue Outlook:
Alliqua now expects total revenue for the twelve-months ending December 31, 2016, of $18.3 million to $19.0 million, which compares to the Company’s prior guidance for total revenue of $18.3 million to $20.3 million. The Company’s guidance range is based on revenue from continuing operations, which excludes $1.7 million of revenue from sales of sorbion products for the fiscal year period following the Company’s sale of the sorbion product franchise.
The Company’s revenue guidance represents growth in the range of approximately 50% to 56% year-over-year, compared to $12.2 million for the fiscal year ended December 31, 2015. Fiscal year 2015 revenue of $12.2 million is on a continuing operations basis and excludes approximately $2.9 million of revenue from sales of sorbion products which are now included in discontinued operations.
The Company’s revenue guidance represents growth in the range of approximately 13% to 17% year-over-year on a pro-forma basis. Pro-forma growth rates are on a continuing operations basis and assume Alliqua had acquired Celleration as of January 1, 2015 resulting in pro-forma revenue from continuing operations of $16.3 million for the twelve-month period ended December 31, 2015.
Conference Call:
The Company will host a teleconference at 8:00 a.m. Eastern Time on November 4th to discuss the results of the quarter, and to host a question and answer session. Those interested in participating in the call may dial 877-591-4953 (719-325-4796 for international callers) and provide access code 2986730 approximately 10 minutes prior to the start time. A live webcast of the call will be made available on the investor relations section of the Company's website at http://ir.alliqua.com.
For those unable to participate, a replay of the call will be available for two weeks at 888-203-1112 (719-457-0820 for international callers); access code 2986730. The webcast will be archived on the investor relations section of Alliqua’s website.
About Alliqua BioMedical, Inc.
Alliqua is a regenerative technologies company committed to restoring tissue and rebuilding lives. Through its sales and distribution network, together with its proprietary products, Alliqua offers solutions that allow clinicians to utilize the latest advances in regenerative technologies to bring improved patient outcomes to their practices.
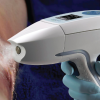
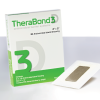
Alliqua currently markets the human biologic regenerative technologies, Biovance® and Interfyl®. The Company also markets its Mist Therapy System®, which uses painless, noncontact low-frequency ultrasound to stimulate cells below the wound bed to promote the healing process. In addition to these technologies, Alliqua markets its line of dressings for wound care under the SilverSeal® and Hydress® brands, as well as its TheraBond 3D® advanced dressing which incorporates the TheraBond 3D® Antimicrobial Barrier Systems technology.
In addition, Alliqua can provide a custom manufacturing solution to partners in the medical device and cosmetics industry, utilizing its hydrogel technology. The Company has locations in Yardley, Pennsylvania, Langhorne, Pennsylvania and Eden Prairie, Minnesota.
For additional information, please visit http://www.alliqua.com. To receive future press releases via email, please visit http://ir.stockpr.com/alliqua/email-alerts.
Legal Notice Regarding Forward-Looking Statements:
This release contains forward-looking statements. Forward-looking statements are generally identifiable by the use of words like "may," "will," "should," "could," "expect," "anticipate," "estimate," "believe," "intend," or "project" or the negative of these words or other variations on these words or comparable terminology. The reader is cautioned not to put undue reliance on these forward-looking statements, as these statements are subject to numerous factors and uncertainties outside of our control that can make such statements untrue, including, but not limited to, the adequacy of the Company’s liquidity to pursue its complete business objectives; inadequate capital; the Company’s ability to obtain reimbursement from third party payers for its products; loss or retirement of key executives; adverse economic conditions or intense competition; loss of a key customer or supplier; entry of new competitors and products; adverse federal, state and local government regulation; technological obsolescence of the Company’s products; technical problems with the Company’s research and products; the Company’s ability to expand its business through strategic acquisitions; the Company’s ability to integrate acquisitions and related businesses; price increases for supplies and components; and the inability to carry out research, development and commercialization plans. In addition, other factors that could cause actual results to differ materially are discussed in our filings with the SEC, including our most recent Annual Report on Form 10-K filed with the SEC, and our most recent Form 10-Q filings with the SEC. Investors and security holders are urged to read these documents free of charge on the SEC's web site at http://www.sec.gov. We undertake no obligation to publicly update or revise our forward-looking statements as a result of new information, future events or otherwise.
| ALLIQUA BIOMEDICAL, INC. AND SUBSIDIARIES | |||||||||||
| CONDENSED CONSOLIDATED BALANCE SHEETS | |||||||||||
| (in thousands, except share and per share data) | |||||||||||
| September 30, | December 31, | ||||||||||
| 2016 | 2015 | ||||||||||
| (Unaudited) | |||||||||||
| ASSETS: | |||||||||||
| Current Assets: | |||||||||||
| Cash and cash equivalents | $ | 10,701 | $ | 26,080 | |||||||
| Accounts receivable, net | 2,705 | 2,060 | |||||||||
| Inventory, net | 3,226 | 2,275 | |||||||||
| Prepaid expenses and other current assets | 890 | 942 | |||||||||
| Current assets of discontinued operations | 28 | 1,315 | |||||||||
| Total current assets | 17,550 | 32,672 | |||||||||
| Improvements and equipment, net | 2,211 | 1,847 | |||||||||
| Intangible assets, net | 31,056 | 33,667 | |||||||||
| Goodwill | 21,166 | 21,166 | |||||||||
| Other assets | 173 | 173 | |||||||||
| Note receivable | 503 | - | |||||||||
| Assets of discontinued operations - noncurrent | - | 227 | |||||||||
| Total assets | $ | 72,659 | $ | 89,752 | |||||||
| LIABILITIES AND STOCKHOLDERS' EQUITY | |||||||||||
| Current Liabilities: | |||||||||||
| Accounts payable | $ | 2,590 | $ | 2,594 | |||||||
| Accrued expenses and other current liabilities | 3,947 | 3,071 | |||||||||
| Contingent consideration, current | 1,399 | 2,573 | |||||||||
| Long-term debt, net | 11,336 | - | |||||||||
| Warrant liability | 64 | 861 | |||||||||
| Current liabilities of discontinued operations | - | 103 | |||||||||
| Total current liabilities | 19,336 | 9,202 | |||||||||
| Long-term debt, net | - | 12,126 | |||||||||
| Contingent consideration, long-term | 1,848 | 14,455 | |||||||||
| Deferred tax liability | 1,477 | 1,468 | |||||||||
| Other long-term liabilities | 1,359 | 76 | |||||||||
| Total liabilities | 24,020 | 37,327 | |||||||||
| Commitments and Contingencies | |||||||||||
| Stockholders' Equity | |||||||||||
| Preferred Stock, par value $0.001 per share, 1,000,000 shares authorized, no shares issued and outstanding | - | - | |||||||||
| Common Stock, par value $0.001 per share, 95,000,000 shares authorized; 29,672,025 and 27,668,913 shares issued and outstanding as of September 30, 2016 and December 31, 2015, respectively | 30 | 28 | |||||||||
| Additional paid-in capital | 155,767 | 148,457 | |||||||||
| Accumulated deficit | (107,158 | ) | (96,060 | ) | |||||||
| Total stockholders' equity | 48,639 | 52,425 | |||||||||
| Total liabilities and stockholders' equity | $ | 72,659 | $ | 89,752 | |||||||
| ALLIQUA BIOMEDICAL, INC. AND SUBSIDIARIES | |||||||||||||||||
| CONDENSED CONSOLIDATED STATEMENTS OF OPERATIONS | |||||||||||||||||
| (Unaudited) | |||||||||||||||||
| (in thousands, except share and per share data) | |||||||||||||||||
| Three Months Ended September 30, | Nine Months Ended September 30, | ||||||||||||||||
| 2016 | 2015 | 2016 | 2015 | ||||||||||||||
| Revenue, net of returns, allowances and discounts | $ | 4,874 | $ | 4,185 | $ | 13,298 | $ | 8,234 | |||||||||
| Cost of revenues | 1,766 | 1,436 | 4,955 | 3,658 | |||||||||||||
| Gross profit | 3,108 | 2,749 | 8,343 | 4,576 | |||||||||||||
| Operating expenses | |||||||||||||||||
| Selling, general and administrative | 8,902 | 10,151 | 28,307 | 24,661 | |||||||||||||
| Research and product development | 164 | 192 | 692 | 493 | |||||||||||||
| Milestone expense to licensor | 1,000 | - | 1,000 | - | |||||||||||||
| Acquisition-related | 715 | 15 | 819 | 2,875 | |||||||||||||
| Change in fair value of contingent consideration liability | 97 | 585 | (8,634 | ) | 957 | ||||||||||||
| Total operating expenses | 10,878 | 10,943 | 22,184 | 28,986 | |||||||||||||
| Loss from operations | (7,770 | ) | (8,194 | ) | (13,841 | ) | (24,410 | ) | |||||||||
| Other (expense) income | |||||||||||||||||
| Interest expense | (686 | ) | (667 | ) | (1,957 | ) | (900 | ) | |||||||||
| Interest income | 9 | 13 | 24 | 31 | |||||||||||||
| Change in fair value of warrant liability | 135 | 1,466 | 797 | 1,388 | |||||||||||||
| Loss on early extinguishment of debt | (373 | ) | - | (373 | ) | - | |||||||||||
| Other income | 100 | - | 100 | - | |||||||||||||
| Total other (expense) income | (815 | ) | 812 | (1,409 | ) | 519 | |||||||||||
| Loss from continuing operations before tax | (8,585 | ) | (7,382 | ) | (15,250 | ) | (23,891 | ) | |||||||||
| Income tax (expense) benefit | (3 | ) | (129 | ) | (9 | ) | 1,308 | ||||||||||
| Loss from continuing operations | (8,588 | ) | (7,511 | ) | (15,259 | ) | (22,583 | ) | |||||||||
| Discontinued operations: | |||||||||||||||||
| Income from discontinued operations, net of tax of $0 for the three and nine months ended September 30, 2016 and 2015 | - | 379 | 850 | 799 | |||||||||||||
| Gain on sale of assets, net of tax of $0 for the three and nine months ended September 30, 2016 and 2015 | - | - | 3,311 | - | |||||||||||||
| Income from discontinued operations, net of tax | - | 379 | 4,161 | 799 | |||||||||||||
| Net loss | $ | (8,588 | ) | $ | (7,132 | ) | $ | (11,098 | ) | $ | (21,784 | ) | |||||
| Net loss per basic and diluted common share: | |||||||||||||||||
| Loss from continuing operations | $ | (0.30 | ) | $ | (0.27 | ) | $ | (0.55 | ) | $ | (1.04 | ) | |||||
| Income from discontinued operations | - | 0.01 | 0.03 | 0.04 | |||||||||||||
| Gain on sale of assets | - | - | 0.12 | - | |||||||||||||
| Total from discontinued operations | - | 0.01 | 0.15 | 0.04 | |||||||||||||
| Net loss per basic and diluted common share | $ | (0.30 | ) | $ | (0.26 | ) | $ | (0.40 | ) | $ | (1.00 | ) | |||||
| Weighted average shares used in computing basic and diluted net loss per common share | 28,195,674 | 26,930,880 | 27,886,959 | 21,742,504 | |||||||||||||
Use of Non-GAAP Financial Measures
We present these non-GAAP measures because we believe these measures are useful indicators of our operating performance. Our management uses these non-GAAP measures principally as a measure of our operating performance and believes that these measures are useful to investors because they are frequently used by analysts, investors and other interested parties to evaluate companies in our industry. We also believe that these measures are useful to our management and investors as a measure of comparative operating performance from period to period.
The Company has presented the following non-GAAP financial measures in this press release: non-GAAP net loss from continuing operations and non-GAAP net loss from continuing operations per share. The Company defines non-GAAP net loss from continuing operations as its reported net loss (GAAP) excluding income tax expense (benefit), stock-compensation expense, one-time charges and other non-recurring operating costs and expenses, intangible asset amortization, change in fair value of contingent consideration, change in value of warrant liability and income from discontinued operations.
| ALLIQUA BIOMEDICAL, INC. AND SUBSIDIARIES | |||||||||||||
| Reconciliation of GAAP results to Non-GAAP results from continuing operations | |||||||||||||
| (Unaudited) | |||||||||||||
| Three Months Ended September 30, | Nine Months Ended September 30, | ||||||||||||
| (U.S. dollars in thousands) | 2016 | 2015 | 2016 | 2015 | |||||||||
| Table of Reconciliation from GAAP Net Loss to Non-GAAP Net Loss from Continuing Operations | |||||||||||||
| GAAP Net Loss | $ | (8,588 | ) | $ | (7,132 | ) | $ | (11,098 | ) | $ | (21,784 | ) | |
| Income tax expense (benefit) | 3 | 129 | 9 | (1,308 | ) | ||||||||
| Change in fair value of warrant liability | (135 | ) | (1,466 | ) | (797 | ) | (1,388 | ) | |||||
| Stock-based compensation | 1,188 | 2,257 | 4,268 | 6,580 | |||||||||
| Intangible asset amortization | 870 | 870 | 2,610 | 1,500 | |||||||||
| Acquisition related expenses | 715 | 15 | 819 | 2,876 | |||||||||
| Change in fair value of contingent consideration | 97 | 585 | (8,634 | ) | 957 | ||||||||
| Other* | 1,273 | - | 1,273 | - | |||||||||
| (Income)/Loss from discontinued ops, net | $ | - | $ | (379 | ) | $ | (4,161 | ) | $ | (799 | ) | ||
| Non-GAAP Net Loss from Continuing Operations | $ | (4,577 | ) | $ | (5,121 | ) | $ | (15,711 | ) | $ | (13,366 | ) | |
| Table Comparing GAAP Diluted Net Loss Per Common Share to Non-GAAP Diluted Net Loss from Continuing Operations Per Common Share | |||||||||||||
| GAAP Diluted Net Loss Per Common Share | $ | (0.30 | ) | $ | (0.26 | ) | $ | (0.40 | ) | $ | (1.00 | ) | |
| Non-GAAP diluted Net Loss from Continuing Operations Per Common Share | $ | (0.16 | ) | $ | (0.19 | ) | $ | (0.56 | ) | $ | (0.61 | ) | |
| Shares used in computing GAAP net loss per common share & non-GAAP diluted net loss from continued operations per common share |
28,195,674 | 26,930,880 | 27,886,959 | 21,742,504 | |||||||||
| *"Other" includes $1,000,000 of milestone expense for achieving two of the three milestones under the license agreement with HLI related to the launch of the Interfyl product, a loss on early extinguishment of debt of $373,000, and other income of $100,000. | |||||||||||||
Investor Relations:
Westwicke Partners on behalf of Alliqua BioMedical, Inc.
Mike Piccinino, CFA +1-443-213-0500
[email protected]
Source: Alliqua BioMedical, Inc


