FY’16 Product revenue from continuing operations increased 60% year-over-year, led by Biologics growth in excess of 115% year-over-year
YARDLEY, Pa., March 07, 2017 (GLOBE NEWSWIRE) -- Alliqua BioMedical, Inc. (Nasdaq:ALQA) ("Alliqua" or "the Company"), a regenerative technologies company committed to restoring tissue and rebuilding lives, today announced financial results for the fourth quarter and fiscal year ended December 31, 2016.
Fourth Quarter 2016 Summary:
- Total revenue increased 25% year-over-year to $4.9 million. Total revenue in the fourth quarter of 2015 excludes approximately $835 thousand of sales that are now included in discontinued operations following the sale of the Company’s sorbion product franchise announced on July 7, 2016.
- Product revenue from continuing operations increased 36% year-over-year to $4.7 million.
- Gross margin was 66%, compared to 60% in the same period last year and 64% in the third quarter of fiscal year 2016.
Fourth Quarter 2016 Operating Highlights:
- The Company announced that its MIST Therapy System® is eligible for Medicare reimbursement coverage in the geographic regions covered by First Coast Service Options Inc. (“First Coast”), a Medicare Administrative Contractor, or “MAC.” With the addition of coverage from First Coast, Medicare coverage for MIST Therapy now includes all Medicare Administrative Contractors in the United States.
- The Company hosted two symposia at the Fall 2016 Symposium on Advanced Wound Care (“SAWC”) in Las Vegas, Nevada.
Announcements Subsequent to Quarter-End:
- On February 28, 2017, the Company announced a private placement of approximately $2.8 million, which was led by one of Alliqua’s strategic investors and included participation from a member of the Company’s Board of Directors, as well as other accredited investors. Under the terms of the private placement, the Company agreed to sell an aggregate of 5,540,000 shares of its common stock at the price of $0.50 per share.
- On February 28,2017 the Company announced the termination of its agreement to acquire the business of Soluble Systems, LLC (“Soluble”).
Fiscal Year 2016 Summary:
- Total revenue increased 50% year-over-year to $18.2 million. Total revenue in fiscal years 2016 and 2015 exclude approximately $1.7 million and $2.9 million, respectively, of sales that are now included in discontinued operations following the sale of the Company’s sorbion product franchise announced on July 7, 2016.
- Product revenue from continuing operations increased 60% year-over-year to $16.1 million.
- Gross margin was 64% in fiscal year 2016, compared to 57% in the prior year.
“Our fourth quarter total revenue results were driven by strong growth in sales of our Biologics products, a continuation of the trends we have seen throughout the year in 2016,” said David Johnson, Chief Executive Officer of Alliqua BioMedical. “Our Biovance® Human Amniotic Membrane Allograft was notably strong in the fourth quarter with growth of more than 200% year-over-year, and our second biologic product, Interfyl Human Connective Tissue Matrix, is demonstrating impressive commercial traction following its launch in the third quarter of 2016.”
“Our results for the fourth quarter reflect our continued progress toward building our capabilities as a leading provider of regenerative solutions. In 2017, the Company is committed to furthering our recent momentum in regenerative technologies and to driving impressive growth in our business. We remain focused on securing the requisite capital to finance our growth initiatives, and recently closed a private placement of approximately $2.8 million to fund our operations in the interim. Lastly, while the termination of the Soluble transaction represents a change in strategy for our business, we believe the Alliqua organic growth opportunity remains extremely compelling, and we look forward to building on the strong growth we reported this year, fueled by the continued adoption of Biovance, the broader commercial rollout of our Interfyl Human Connective Tissue Matrix and the increasing awareness among regenerative medicine practitioners of the strong clinical efficacy of our MIST Therapy System.”
Fourth Quarter 2016 Results:
| Alliqua BioMedical, Inc. and Subsidiaries | |||||||||||||||||||||||||
| Revenue Summary* | |||||||||||||||||||||||||
| Three Months Ended | Year Ended | ||||||||||||||||||||||||
| ($, Thousands) | December 31, | Increase / Decrease | December 31, | Increase / Decrease | |||||||||||||||||||||
| 2016 | 2015 | $ Change | % Change | 2016 | 2015 | $ Change | % Change | ||||||||||||||||||
| Products | $4,671 | $3,433 | $1,238 | 36 | % | $16,088 | $10,041 | $6,047 | 60 | % | |||||||||||||||
| Contract Manufacturing | $271 | $509 | -$238 | -47 | % | $2,152 | $2,136 | $16 | 1 | % | |||||||||||||||
| Revenue, net | $4,942 | $3,942 | $1,000 | 25 | % | $18,240 | $12,177 | $6,063 | 50 | % | |||||||||||||||
| *Revenue summary reflects the Company's continued operations, and, therefore, excludes approximately $0 and $1.7 million of | |||||||||||||||||||||||||
| sorbion revenue recognized during the three months and fiscal year ended December 31, 2016, and $835 thousand and $2.9 million of sorbion | |||||||||||||||||||||||||
| revenue recognized during the three months and fiscal year ended December 31, 2015, respectively, that is included in discontinued operations. | |||||||||||||||||||||||||
Total revenue for the fourth quarter of 2016 increased by approximately $1.0 million, or 25% year-over-year, to $4.9 million, compared to $3.9 million last year. Total revenue for the fourth quarter of 2015 excluded revenue from sales of sorbion products of approximately $835 thousand that is included in discontinued operations following the Company’s sale of the sorbion product franchise. Sales of the Company’s products – including Biovance, Interfyl, TheraBond and MIST Therapy – increased by $1.2 million, or 36% year-over-year, to $4.7 million, from $3.4 million last year. Sales of our biologics products and MIST Therapy were the largest contributors to fourth quarter products growth.
Gross profit for the fourth quarter of 2016 was $3.2 million, or 66% of sales, compared to a gross profit of $2.4 million, or 60% of sales, last year. Gross margin on product sales was approximately 76% in the fourth quarter of 2016, compared to 78% of sales last year. The decline in product gross margin was due primarily to lower margins on MIST Therapy systems year-over-year.
Total operating expenses for the fourth quarter of 2016 increased by $13.1 million, or 176% year-over-year, to $20.6 million. The increase in total operating expenses in the period was driven primarily by an impairment charge of $10.9 million related to the Company’s goodwill and MIST Therapy tradename. The increase in operating expense compared to last year was also impacted by $2.1 million of expenses related to the recently terminated agreement to acquire Soluble. The increase in these expenses was partially offset by a reduction of $1.4 million in the fair value of the Company’s contingent consideration liability.
GAAP loss from operations for the fourth quarter of 2016 was $17.3 million, compared to a loss of $5.1 million for the same period last year.
GAAP net loss for the fourth quarter of 2016 was $17.1 million, or ($0.61) per diluted share, compared to a GAAP net loss of $4.2 million, or ($0.16) per diluted share, for the same period last year. The change in GAAP net loss in the fourth quarter of 2016 was driven primarily by an increase in non-cash operating expenses, specifically the Company’s impairment charge to goodwill and trade name of $10.9 million and, to a lesser extent, a decrease in gain from changes in fair value of the Company’s warrant liability of $660 thousand.
Non-GAAP net loss from continuing operations for the fourth quarter of 2016 was $4.8 million, or ($0.17) per diluted share, compared to a non-GAAP net loss from continuing operations of $5.3 million, or ($0.19) per diluted share, for the same period last year. The Company defines non-GAAP net loss from continuing operations as its reported net loss (GAAP), excluding income tax expense (benefit), stock-compensation expense, one-time charges and other non-recurring operating costs and expenses, intangible asset amortization, change in fair value of contingent consideration, change in value of warrant liability, impairment charges to goodwill and other intangibles and income from discontinued operations.
Fiscal Year 2016 Results:
Total revenue for the year ended December 31, 2016 increased $6.1 million, or 50% year-over-year, to $18.2 million. Total revenue for the years ended December 31, 2016 and 2015 exclude $1.7 million and $2.9 million, respectively, of revenue from sales of sorbion products recorded as discontinued operations following the Company’s sale of the sorbion product franchise. Sales of the Company's products – including Biovance, Interfyl, TheraBond and MIST Therapy – increased $6.0 million, or 60%, year-over-year. Total 2016 revenue includes a full year of sales of MIST Therapy, while 2015 revenue includes only seven months of sales of MIST Therapy as the Company acquired the technology on May 29, 2015 from the acquisition of Celleration.
Gross profit for fiscal year 2016 increased $4.6 million to $11.6 million, or 64% of total sales, compared to a gross profit of $7.0 million last year, or 57% of total sales. The increase in gross margin was due to products sales comprising a greater portion of the Company’s revenue. Product sales typically command higher gross profit margins than contract manufacturing sales. Gross margin on product sales was approximately 76% in fiscal year 2016, compared to 79% of sales last year. The decline in product gross margin was due primarily to lower margins on MIST Therapy systems year-over-year.
GAAP net loss for the fiscal years ended December 31, 2016 and 2015, was $28.2 million, or $(1.01) per diluted share, and $26.0 million, or $(1.13) per diluted share, respectively. GAAP net loss for the fiscal years ended December 31, 2016 and 2015 included $4.2 million, or $0.15 per diluted share, and $1.2 million, or $0.05 per diluted share, respectively, of income from discontinued operations.
Non-GAAP net loss from continuing operations for the fiscal year ended December 31, 2016 was $20.6 million, or $(0.73) per diluted share, compared to a non-GAAP net loss from continuing operations of $18.6 million, or $(0.81) per diluted share in the prior year period. The Company defines non-GAAP net loss from continuing operations as its reported net loss (GAAP) excluding income tax expense (benefit), stock-compensation expense, one-time charges and other non-recurring operating costs and expenses, intangible asset amortization, change in fair value of contingent consideration, change in value of warrant liability, impairment charges to goodwill and other intangibles and income from discontinued operations.
Cash and Cash Equivalents:
As of December 31, 2016, the Company had cash and cash equivalents of approximately $5.6 million, compared to $26.1 million at December 31, 2015. The decrease in cash was driven by $18.3 million of cash used in operating activities, $2.6 million of cash used to pay a portion of the contingent consideration related to the Celleration acquisition, $1.8 million of cash used to repay a portion of the Company’s long-term debt, $1.0 million provided to Soluble as a bridge loan and purchases of improvements and equipment of $0.9 million. Cash used in connection with the recently terminated agreement to acquire Soluble was approximately $1.6 million and $2.3 million for the three and twelve months ended December 31, 2016, respectively. The decrease in cash during the twelve months ended December 31, 2016, was partially offset by $4.1 million of cash received in connection with the sale of the rights to the sorbion product from BSN.
Fiscal Year 2017 Revenue Outlook:
For the fiscal year ending December 31, 2017, the Company expects total revenue of $19.8 million to $20.7 million, representing growth in the range of approximately 9% to 13% year-over-year on a GAAP basis.
The Company’s total revenue guidance assumes the following:
- Product sales of $19.0 million to $19.9 million, representing growth in the range of approximately 18% to 24% year-over-year compared to product sales of $16.1 million in the fiscal year ended December 31, 2016.
- Contract manufacturing sales of approximately $0.8 million, compared to $2.2 million in the fiscal year ended December 31, 2016.
Subsequent to December 31, 2016, the Company was notified by a customer of its contract manufacturing services of its intent not to use the Company’s contract manufacturing services for the fiscal year ending December 31, 2017. We believe the loss of this business will not have a material impact on our financial condition and results of operations, since our strategic focus remain growing sales of our higher margin regenerative technology products. The Company has initiated a process of identifying strategic alternatives for the contract manufacturing business to maximize shareholder value, which includes the potential sale or other uses of the business.
Conference Call:
The Company will host a teleconference at 5:00 p.m. Eastern Time on March 7th to discuss the results of the quarter, and to host a question and answer session. Those interested in participating on the call may dial 800-474-8920 (719-325-2249 for international callers) and provide access code 6277436 approximately 10 minutes prior to the start time. A live webcast of the call will be made available on the investor relations section of the Company's website at http://ir.alliqua.com.
For those unable to participate, a replay of the call will be available for two weeks at 888-203-1112 (719-457-0820 for international callers); access code 6277436. The webcast will be archived on the investor relations section of Alliqua’s website.
About Alliqua BioMedical, Inc.
Alliqua is a regenerative technologies company committed to restoring tissue and rebuilding lives. Through its sales and distribution network, together with its proprietary products, Alliqua offers solutions that allow clinicians to utilize the latest advances in regenerative technologies to bring improved patient outcomes to their practices.
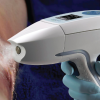
Alliqua currently markets the human biologic regenerative technologies, Biovance® and Interfyl™. The Company also markets its Mist Therapy System®, which uses painless, noncontact low-frequency ultrasound to stimulate cells below the wound bed to promote the healing process. In addition to these technologies, Alliqua markets its line of dressings for wound care under the SilverSeal® and Hydress® brands, as well as its TheraBond 3D® advanced dressing which incorporates the TheraBond 3D® Antimicrobial Barrier Systems technology.
In addition, Alliqua can provide a custom manufacturing solution to partners in the medical device and cosmetics industry, utilizing its hydrogel technology. The Company has locations in Yardley, Pennsylvania, Langhorne, Pennsylvania and Eden Prairie, Minnesota.
For additional information, please visit http://www.alliqua.com. To receive future press releases via email, please visit http://ir.stockpr.com/alliqua/email-alerts.
Legal Notice Regarding Forward-Looking Statements:
This release contains forward-looking statements. Forward-looking statements are generally identifiable by the use of words like "may," "will," "should," "could," "expect," "anticipate," "estimate," "believe," "intend," or "project" or the negative of these words or other variations on these words or comparable terminology. The reader is cautioned not to put undue reliance on these forward-looking statements, as these statements are subject to numerous factors and uncertainties outside of our control that can make such statements untrue, including, but not limited to, the adequacy of the Company’s liquidity to pursue its complete business objectives; inadequate capital; the Company’s ability to obtain reimbursement from third party payers for its products; loss or retirement of key executives; adverse economic conditions or intense competition; loss of a key customer or supplier; entry of new competitors and products; adverse federal, state and local government regulation; technological obsolescence of the Company’s products; technical problems with the Company’s research and products; the Company’s ability to expand its business through strategic acquisitions; the Company’s ability to integrate acquisitions and related businesses; price increases for supplies and components; and the inability to carry out research, development and commercialization plans. In addition, other factors that could cause actual results to differ materially are discussed in our filings with the SEC, including our most recent Annual Report on Form 10-K filed with the SEC, and our most recent Form 10-Q filings with the SEC. Investors and security holders are urged to read these documents free of charge on the SEC's web site at http://www.sec.gov. We undertake no obligation to publicly update or revise our forward-looking statements as a result of new information, future events or otherwise.
| ALLIQUA BIOMEDICAL, INC. AND SUBSIDIARIES | |||||||
| CONSOLIDATED BALANCE SHEETS | |||||||
| (in thousands, except share and per share data) | |||||||
| December 31, | December 31, | ||||||
| 2016 | 2015 | ||||||
| ASSETS: | |||||||
| Current Assets: | |||||||
| Cash and cash equivalents | $ | 5,580 | $ | 26,080 | |||
| Accounts receivable, net | 2,760 | 2,060 | |||||
| Inventory, net | 2,702 | 2,275 | |||||
| Prepaid expenses and other current assets | 735 | 942 | |||||
| Current assets of discontinued operations | - | 1,315 | |||||
| Total current assets | 11,777 | 32,672 | |||||
| Improvements and equipment, net | 2,092 | 1,847 | |||||
| Intangible assets, net | 28,498 | 33,667 | |||||
| Goodwill, net | 11,959 | 21,166 | |||||
| Other assets | 173 | 173 | |||||
| Assets of discontinued operations - noncurrent | - | 227 | |||||
| Total assets | $ | 54,499 | $ | 89,752 | |||
| LIABILITIES AND STOCKHOLDERS' EQUITY | |||||||
| Current Liabilities: | |||||||
| Accounts payable | $ | 2,612 | $ | 2,594 | |||
| Accrued expenses and other current liabilities | 5,286 | 3,071 | |||||
| Contingent consideration, current | 675 | 2,573 | |||||
| Long-term debt, net | 11,541 | - | |||||
| Warrant liability | 20 | 861 | |||||
| Current liabilities of discontinued operations | - | 103 | |||||
| Total current liabilities | 20,134 | 9,202 | |||||
| Long-term debt, net | - | 12,126 | |||||
| Contingent consideration, long-term | 1,141 | 14,455 | |||||
| Deferred tax liability | 749 | 1,468 | |||||
| Other long-term liabilities | 385 | 76 | |||||
| Total liabilities | 22,409 | 37,327 | |||||
| Commitments and Contingencies | |||||||
| Stockholders' Equity | |||||||
| Preferred Stock, par value $0.001 per share, 1,000,000 shares authorized, no shares issued and outstanding | - | - | |||||
| Common Stock, par value $0.001 per share, 95,000,000 shares authorized; 29,669,036 and 27,668,913 shares | |||||||
| issued and outstanding as of December 31, 2016 and December 31, 2015, respectively | 30 | 28 | |||||
| Additional paid-in capital | 156,363 | 148,457 | |||||
| Accumulated deficit | (124,303 | ) | (96,060 | ) | |||
| Total stockholders' equity | 32,090 | 52,425 | |||||
| Total liabilities and stockholders' equity | $ | 54,499 | $ | 89,752 | |||
| ALLIQUA BIOMEDICAL, INC. AND SUBSIDIARIES | ||||||||||||||||
| CONSOLIDATED STATEMENTS OF OPERATIONS | ||||||||||||||||
| (in thousands, except share and per share data) | ||||||||||||||||
| Three Months Ended December 31, | Year Ended December 31, | |||||||||||||||
| 2016 | 2015 | 2016 | 2015 | |||||||||||||
| Revenue, net of returns, allowances and discounts | $ | 4,942 | $ | 3,942 | $ | 18,240 | $ | 12,177 | ||||||||
| Cost of revenues | 1,700 | 1,568 | 6,655 | 5,227 | ||||||||||||
| Gross profit | 3,242 | 2,374 | 11,585 | 6,950 | ||||||||||||
| Operating expenses | ||||||||||||||||
| Selling, general and administrative | 8,818 | 9,678 | 37,125 | 34,340 | ||||||||||||
| Research and product development | 168 | 222 | 859 | 715 | ||||||||||||
| Milestone expense to licensor | - | - | 1,000 | - | ||||||||||||
| Acquisition-related | 2,140 | - | 2,959 | 2,876 | ||||||||||||
| Change in fair value of contingent consideration liability | (1,432 | ) | (2,431 | ) | (10,065 | ) | (1,474 | ) | ||||||||
| Impairment charges | 10,895 | - | 10,895 | - | ||||||||||||
| Total operating expenses | 20,589 | 7,469 | 42,773 | 36,457 | ||||||||||||
| Loss from operations | (17,347 | ) | (5,095 | ) | (31,188 | ) | (29,507 | ) | ||||||||
| Other (expense) income | ||||||||||||||||
| Interest expense | (584 | ) | (665 | ) | (2,541 | ) | (1,565 | ) | ||||||||
| Interest income | 18 | 10 | 42 | 42 | ||||||||||||
| Change in fair value of warrant liability | 44 | 707 | 841 | 2,095 | ||||||||||||
| Loss on early extinguishment of debt | - | - | (373 | ) | - | |||||||||||
| Other income | - | - | 100 | - | ||||||||||||
| Total other (expense) income | (522 | ) | 52 | (1,931 | ) | 572 | ||||||||||
| Loss from continuing operations before tax | (17,869 | ) | (5,043 | ) | (33,119 | ) | (28,935 | ) | ||||||||
| Income tax benefit | 724 | 410 | 715 | 1,718 | ||||||||||||
| Loss from continuing operations | (17,145 | ) | (4,633 | ) | (32,404 | ) | (27,217 | ) | ||||||||
| Discontinued operations: | ||||||||||||||||
| Income from discontinued operations, net of tax of $0 for the three month and years ended December 31, 2016 and 2015 | - | 400 | 850 | 1,200 | ||||||||||||
| Gain on sale of assets, net of tax of $0 for the three month and years ended December 31, 2016 and 2015 | - | - | 3,311 | - | ||||||||||||
| Income from discontinued operations, net of tax | - | 400 | 4,161 | 1,200 | ||||||||||||
| Net loss | $ | (17,145 | ) | $ | (4,233 | ) | $ | (28,243 | ) | $ | (26,017 | ) | ||||
| Net loss per basic and diluted common share: | ||||||||||||||||
| Loss from continuing operations | $ | (0.61 | ) | $ | (0.17 | ) | $ | (1.16 | ) | $ | (1.18 | ) | ||||
| Discontinued operations | ||||||||||||||||
| Income from discontinued operations | - | 0.01 | 0.03 | 0.05 | ||||||||||||
| Gain on sale of assets | - | - | 0.12 | - | ||||||||||||
| Total from discontinued operations | - | 0.01 | 0.15 | 0.05 | ||||||||||||
| Net loss per basic and diluted common share | $ | (0.61 | ) | $ | (0.16 | ) | $ | (1.01 | ) | $ | (1.13 | ) | ||||
| Weighted average shares used in computing basic and diluted net loss per common share | 28,198,808 | 26,977,188 | 27,965,626 | 23,061,931 | ||||||||||||
Use of Non-GAAP Financial Measures
We present these non-GAAP measures because we believe these measures are useful indicators of our operating performance. Our management uses these non-GAAP measures principally as a measure of our operating performance and believes that these measures are useful to investors because they are frequently used by analysts, investors and other interested parties to evaluate companies in our industry. We also believe that these measures are useful to our management and investors as a measure of comparative operating performance from period to period.
The Company has presented the following non-GAAP financial measures in this press release: non-GAAP net loss from continuing operations and non-GAAP net loss from continuing operations per share. The Company defines non-GAAP net loss from continuing operations as its reported net loss (GAAP) excluding income tax expense (benefit), stock-compensation expense, one-time charges and other non-recurring operating costs and expenses, intangible asset amortization, change in fair value of contingent consideration, change in value of warrant liability, impairment charges to goodwill and other intangibles and income from discontinued operations.
| ALLIQUA BIOMEDICAL, INC. AND SUBSIDIARIES | |||||||||||||
| Reconciliation of GAAP results to Non-GAAP results from continuing operations | |||||||||||||
| (Unaudited) | |||||||||||||
| Three Months Ended December 31, | Year Ended December 31, | ||||||||||||
| (U.S. dollars in thousands) | 2016 | 2015 | 2016 | 2015 | |||||||||
| Table of Reconciliation from GAAP Net Loss to Non-GAAP Net Loss from Continuing Operations | |||||||||||||
| GAAP Net Loss | $ | (17,145 | ) | $ | (4,233 | ) | $ | (28,243 | ) | $ | (26,017 | ) | |
| Income tax expense (benefit) | (724 | ) | (410 | ) | (715 | ) | (1,718 | ) | |||||
| Change in fair value of warrant liability | (44 | ) | (707 | ) | (841 | ) | (2,095 | ) | |||||
| Stock-based compensation | 596 | 2,054 | 4,864 | 8,634 | |||||||||
| Intangible asset amortization | 870 | 870 | 3,481 | 2,370 | |||||||||
| Acquisition related expenses | 2,140 | - | 2,959 | 2,876 | |||||||||
| Change in fair value of contingent consideration | (1,432 | ) | (2,431 | ) | (10,065 | ) | (1,474 | ) | |||||
| Other* | 10,895 | - | 12,168 | - | |||||||||
| Income from discontinued ops, net | $ | - | $ | (400 | ) | $ | (4,161 | ) | $ | (1,200 | ) | ||
| Non-GAAP Net Loss from Continuing Operations | $ | (4,844 | ) | $ | (5,257 | ) | $ | (20,553 | ) | $ | (18,624 | ) | |
| Table Comparing GAAP Diluted Net Loss Per Common Share to Non-GAAP Diluted Net Loss from Continuing Operations Per Common Share | |||||||||||||
| GAAP Diluted Net Loss Per Common Share | $ | (0.61 | ) | $ | (0.16 | ) | $ | (1.01 | ) | $ | (1.13 | ) | |
| Non-GAAP diluted Net Loss from Continuing Operations Per Common Share | $ | (0.17 | ) | $ | (0.19 | ) | $ | (0.73 | ) | $ | (0.81 | ) | |
| Shares used in computing GAAP net loss per common share | |||||||||||||
| & non-GAAP diluted net loss from continued operations per common share | 28,198,808 | 26,977,188 | 27,965,626 | 23,061,931 | |||||||||
| *"Other" for the three months ended December 31, 2016 includes the $10.9 million impairment charge related to the Company’s goodwill and MIST Therapy tradename. “Other” for | |||||||||||||
| the year ended December 31, 2016 includes the $10.9 million impairment charged related to the Company’s goodwill and MIST Therapy tradename and $1.3 million of non-recurring | |||||||||||||
| expense/income comprised of (i) $1.0 million of milestone expense payment to HLI related to the launch of the Interfyl product, (ii) $373,000 loss on early extinguishment of debt, and | |||||||||||||
| (iii) other income of $100,000 recognized in conjunction with the sale of sorbion product franchise. | |||||||||||||
Investor Relations:
Westwicke Partners on behalf of Alliqua BioMedical, Inc.
Mike Piccinino, CFA +1-443-213-0500
[email protected]
![]()